Visual Studio Code를 사용한 Microsoft Fabric의 데이터 과학
VS Code 내에서 Microsoft Fabric용 데이터 과학 및 데이터 엔지니어링 솔루션을 구축하고 개발할 수 있습니다. Microsoft Fabric VS Code 확장 프로그램은 Fabric 아티팩트, 레이크하우스, 노트북 및 사용자 데이터 함수 작업을 위한 통합 개발 환경을 제공합니다.
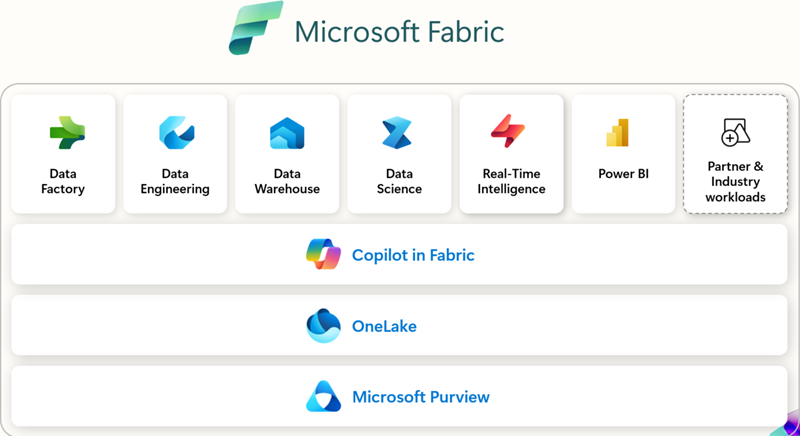
Microsoft Fabric이란?
Microsoft Fabric은 엔터프라이즈급 엔드투엔드 분석 플랫폼입니다. 데이터 이동, 데이터 처리, 수집, 변환, 실시간 이벤트 라우팅 및 보고서 작성을 통합합니다. 데이터 엔지니어링, Data Factory, Data Science, Real-Time Intelligence, Data Warehouse, Databases와 같은 통합 서비스를 통해 이러한 기능을 지원합니다. 무료로 가입하고 60일간 Microsoft Fabric을 살펴보세요. 신용카드 불필요.
전제 조건
VS Code용 Microsoft Fabric 확장을 시작하기 전에 다음이 필요합니다.
- Visual Studio Code: 최신 VS Code 버전을 설치하세요.
- Microsoft Fabric 계정: Microsoft Fabric 작업 영역에 액세스해야 합니다. 시작하려면 무료 평가판에 가입할 수 있습니다.
- Python: VS Code에서 노트북, 사용자 데이터 함수 작업을 위해 Python 3.8 이상을 설치하세요.
설치 및 설정
Visual Studio Marketplace에서 또는 VS Code 내에서 직접 확장 프로그램을 찾아 설치할 수 있습니다. **확장 프로그램** 보기를 선택하고(⇧⌘X (Windows, Linux Ctrl+Shift+X)) **Microsoft Fabric**을 검색하세요.
어떤 확장 프로그램을 사용할까요?
| 확장 프로그램 | 가장 적합한 용도 | 주요 기능 | 이런 경우 권장합니다… | 문서 |
|---|---|---|---|---|
| Microsoft Fabric 확장 프로그램 | 일반적인 작업 영역 관리, 항목 관리 및 항목 정의 작업 | - Fabric 항목 관리 (Lakehouses, Notebooks, Pipelines) - Microsoft 계정 로그인 및 테넌트 전환 - 통합 또는 그룹화된 항목 보기 - IntelliSense를 사용하여 Fabric 노트북 편집 - 명령 팔레트 통합 ( Fabric: 명령) |
VS Code에서 직접 Fabric의 작업 영역, 노트북 및 항목을 관리하는 단일 확장 프로그램을 원할 때. | Fabric VS Code 확장 프로그램이란? |
| Fabric 사용자 데이터 함수 | 사용자 지정 변환 및 워크플로를 구축하는 개발자 | - Fabric에서 서버리스 함수 작성 - 중단점을 사용한 로컬 디버깅 - 데이터 소스 연결 관리 - Python 라이브러리 설치/관리 - 함수를 Fabric 작업 영역에 직접 배포 |
자동화 또는 데이터 변환 로직을 구축하고 VS Code에서 디버깅 + 배포가 필요할 때. | VS Code에서 사용자 데이터 함수 개발 |
| Fabric Data Engineering | 대규모 데이터 및 Spark 작업을 다루는 데이터 엔지니어 | - Lakehouses 탐색 (테이블, 원시 파일) - Spark 노트북 개발/디버깅 - Spark 작업 정의 빌드/테스트 - 로컬 VS Code 및 Fabric 간 노트북 동기화 - 스키마 및 샘플 데이터 미리 보기 |
Spark, Lakehouses 또는 대규모 데이터 파이프라인을 사용하며 로컬에서 탐색, 개발 및 디버그하려는 경우. | VS Code에서 Fabric 노트북 개발 |
시작하기
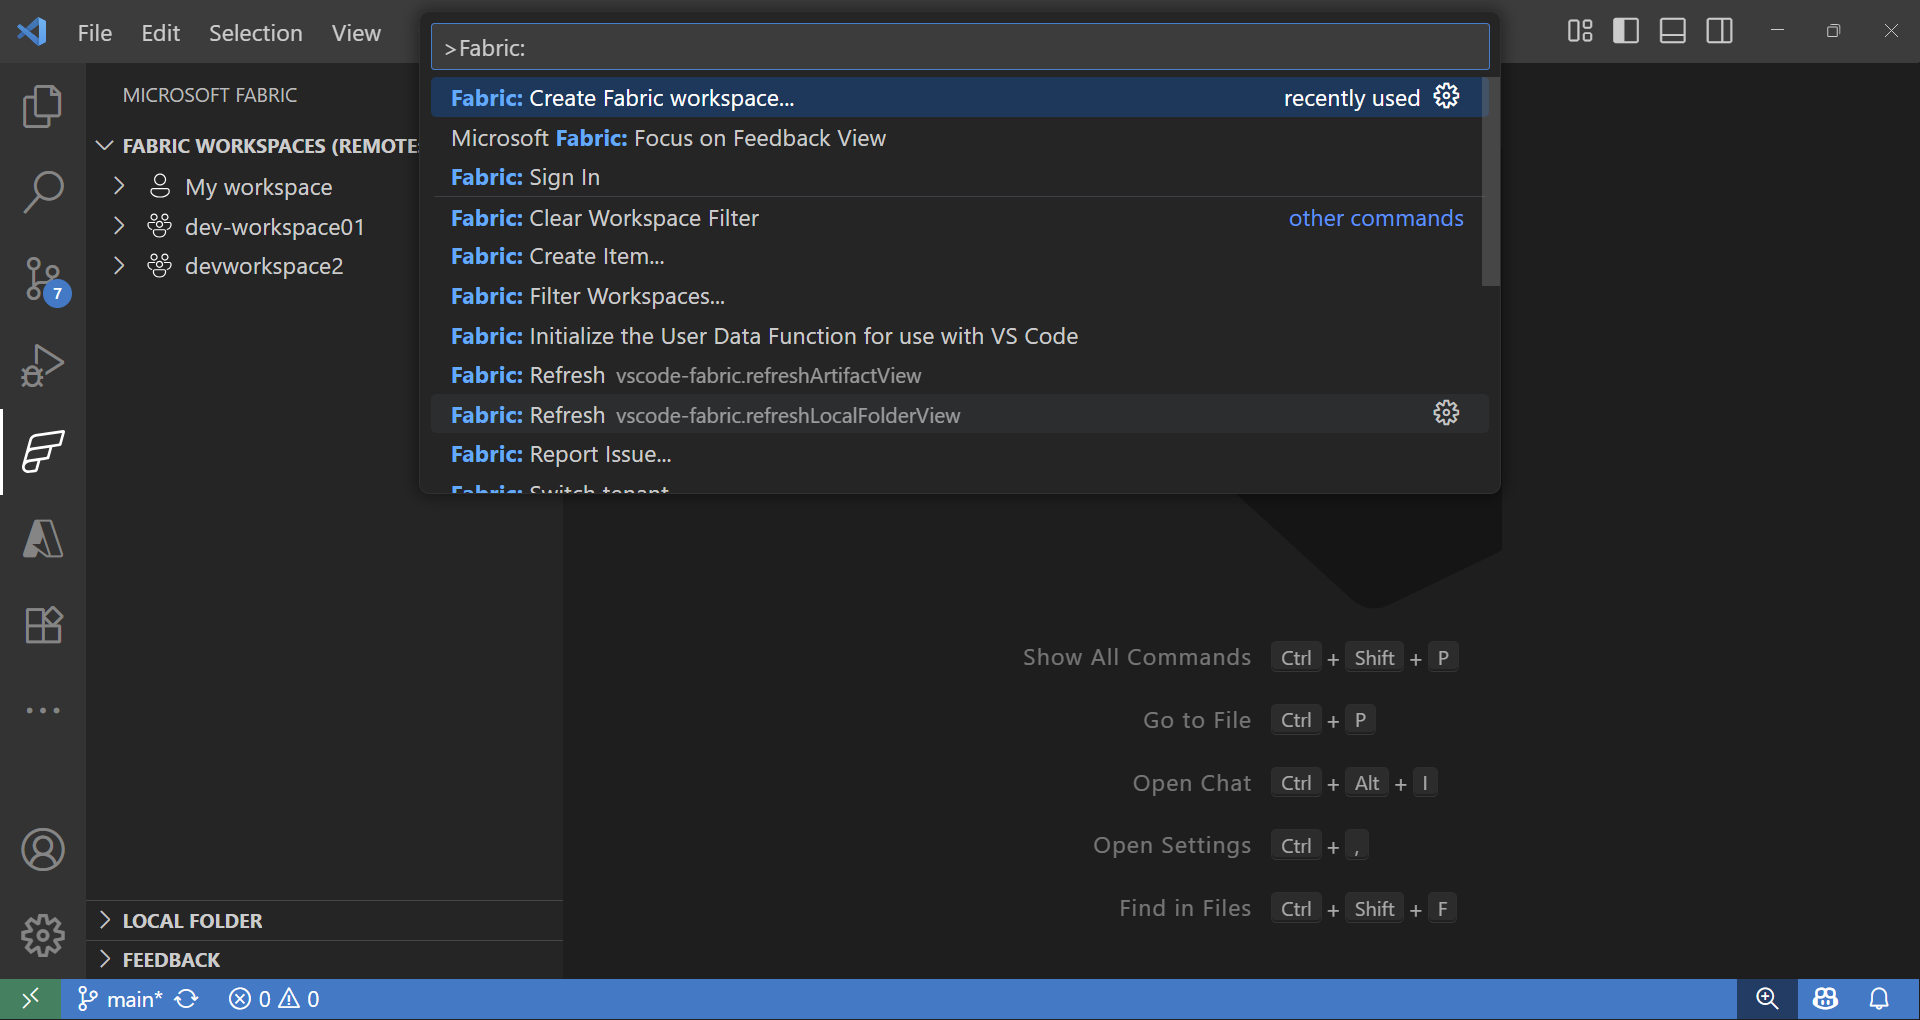
확장 프로그램을 설치하고 로그인하면 Fabric 작업 영역 및 항목 작업을 시작할 수 있습니다. 명령 팔레트에서(⇧⌘P (Windows, Linux Ctrl+Shift+P)) **Fabric**을 입력하면 Microsoft Fabric에 특정한 명령 목록이 표시됩니다.
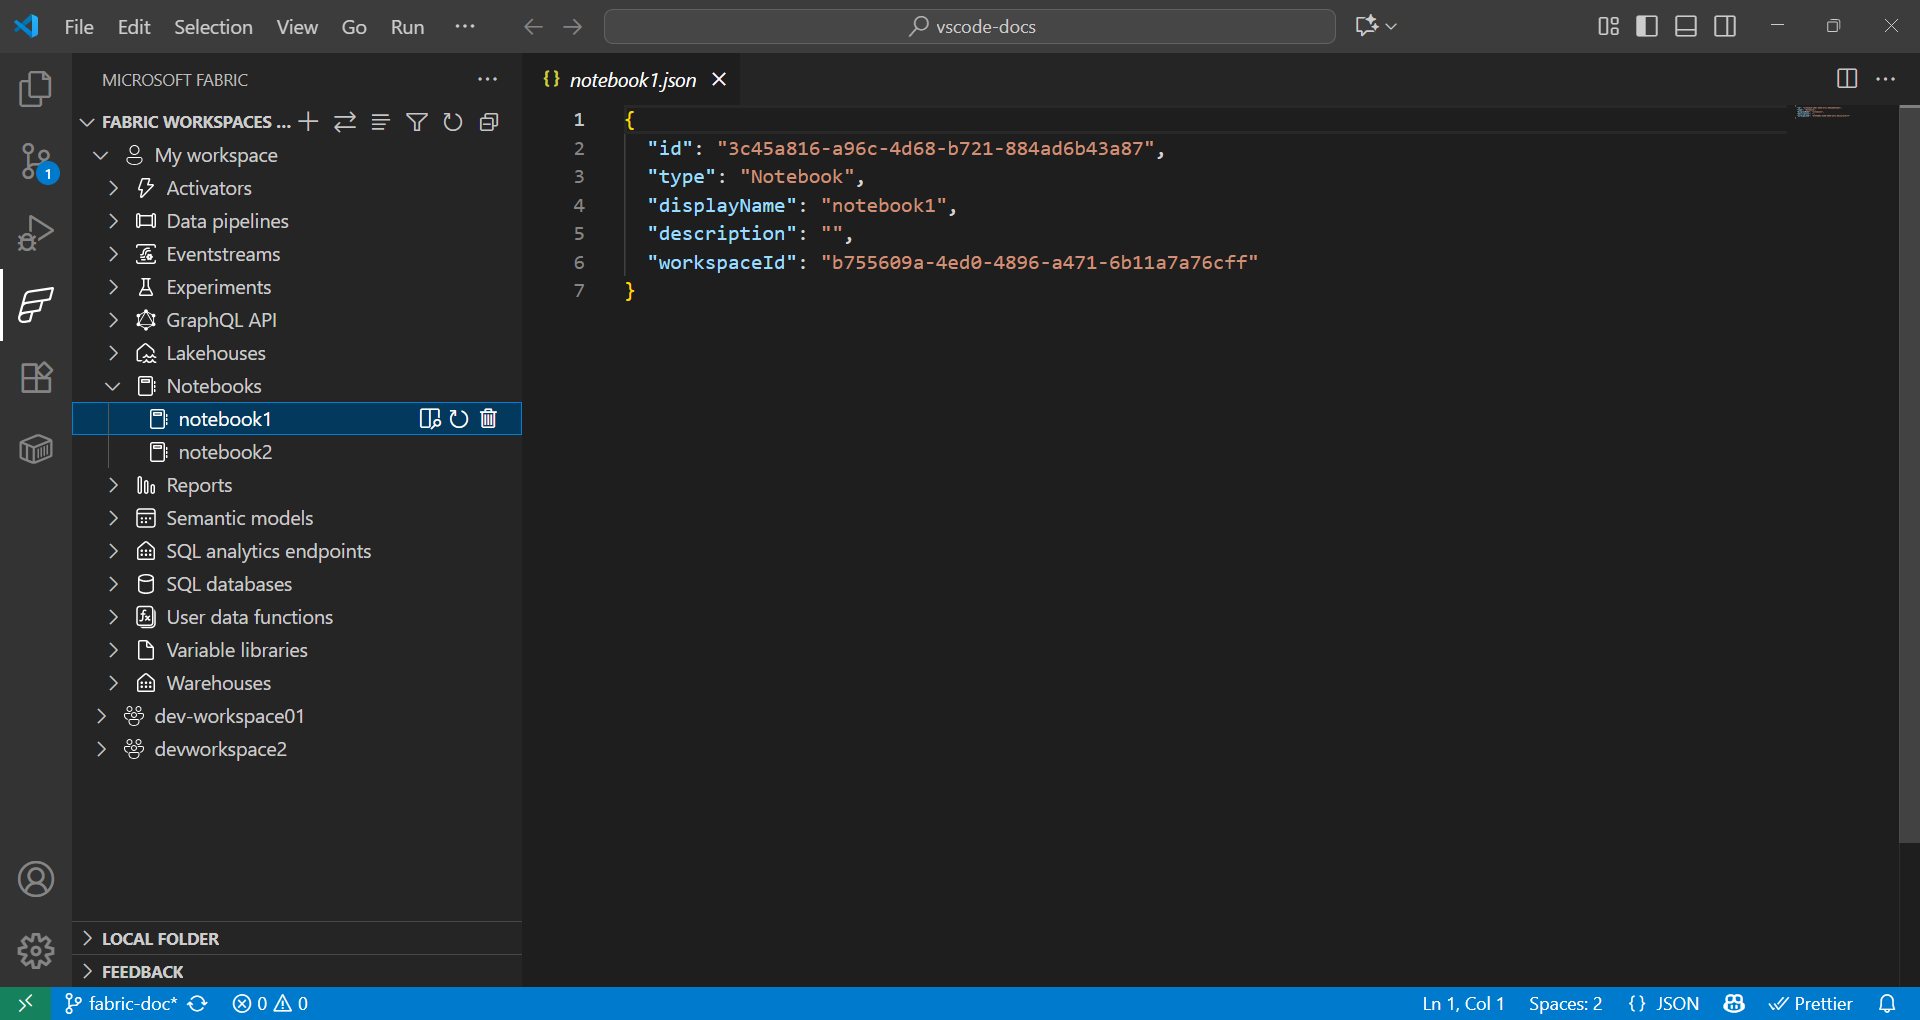
Fabric 작업 영역 및 항목 탐색기
Fabric 확장 프로그램은 원격 및 로컬 Fabric 항목 모두와 원활하게 작업할 수 있는 방법을 제공합니다.
- Fabric 확장 프로그램의 **Fabric 작업 영역** 섹션에는 원격 작업 영역의 모든 항목이 유형별(Lakehouses, Notebooks, Pipelines 등)로 정리되어 나열됩니다.
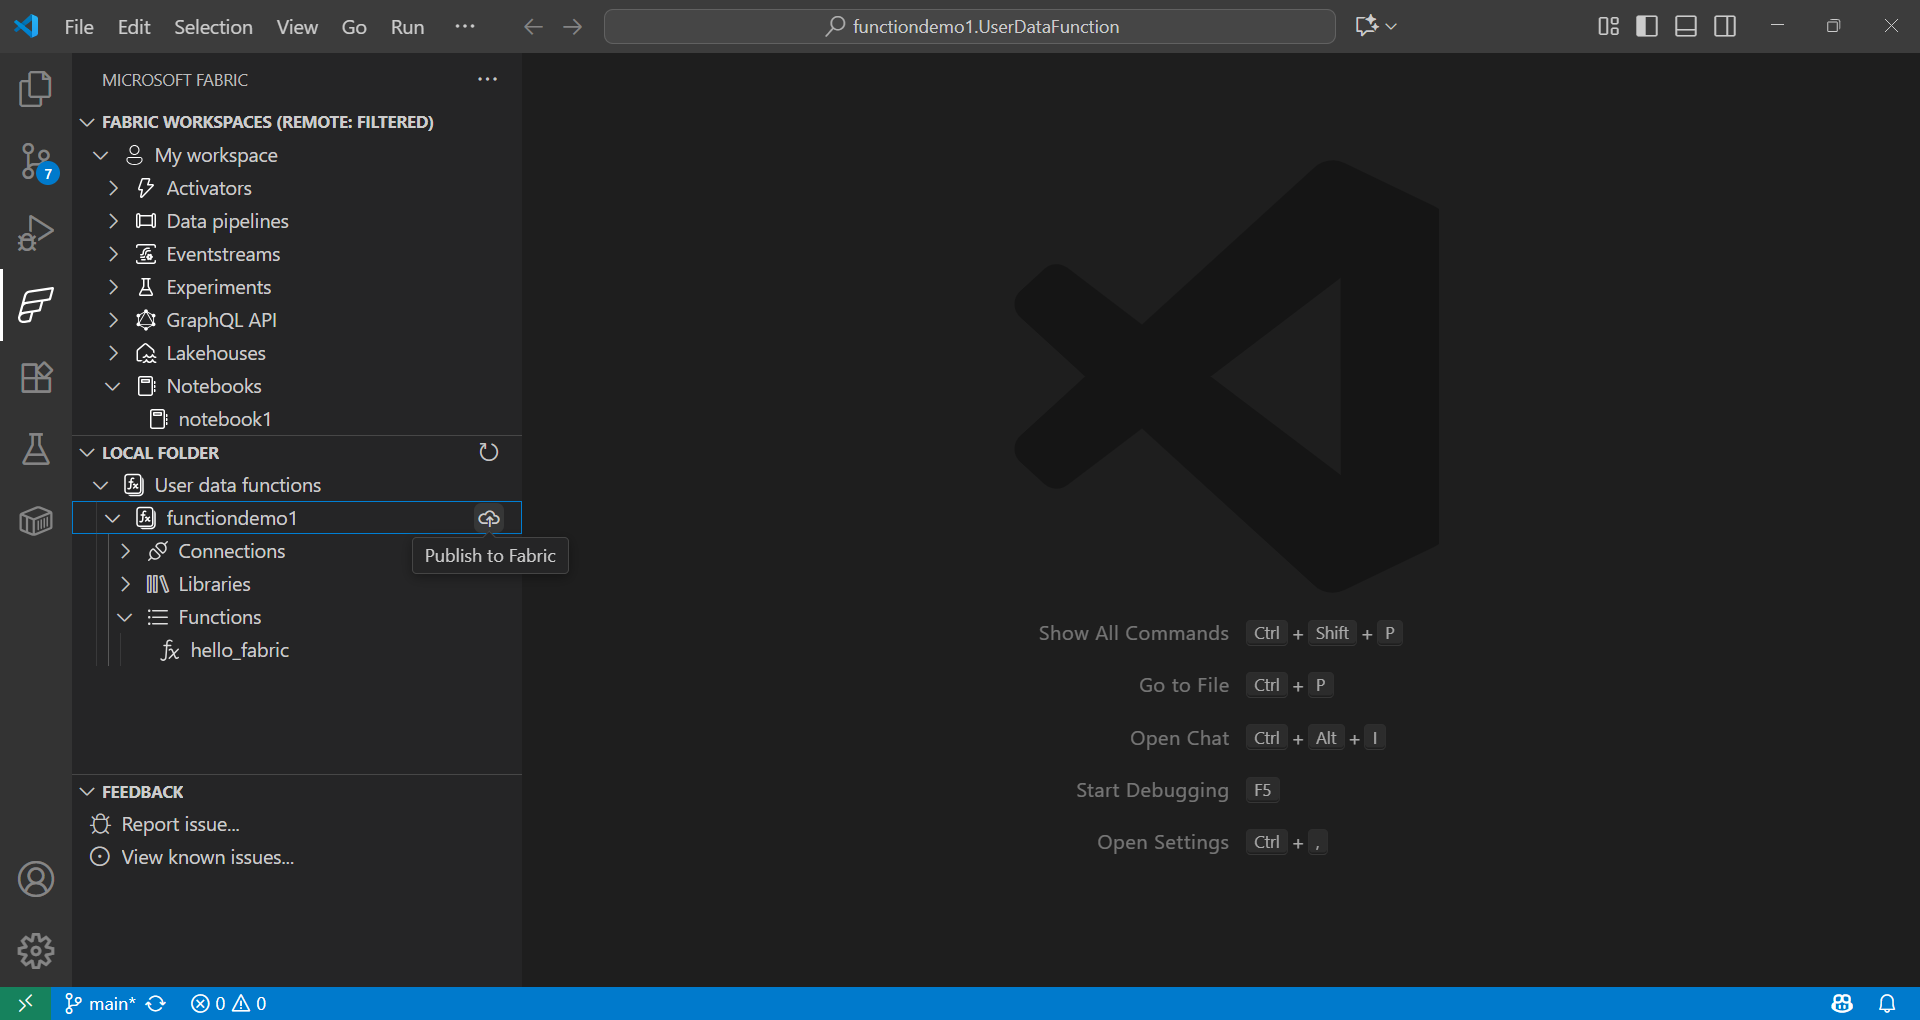
- Fabric 확장 프로그램의 **로컬 폴더** 섹션에는 VS Code에서 열린 Fabric 항목 폴더가 표시됩니다. VS Code에서 열린 각 유형에 대한 Fabric 항목 정의의 구조를 반영합니다. 이를 통해 로컬에서 개발하고 변경 사항을 현재 또는 새 작업 영역에 게시할 수 있습니다.
데이터 과학을 위한 사용자 데이터 함수 사용
-
명령 팔레트에서(⇧⌘P (Windows, Linux Ctrl+Shift+P)) **Fabric: 항목 만들기**를 입력합니다.
-
작업 영역을 선택하고 **사용자 데이터 함수**를 선택합니다. 이름을 지정하고 **Python** 언어를 선택합니다.
-
Python 가상 환경을 설정하라는 알림이 표시되며, 로컬에서 계속 설정합니다.
-
pip install을 사용하여 라이브러리를 설치하거나 Fabric 확장 프로그램에서 사용자 데이터 함수 항목을 선택하여 라이브러리를 추가합니다.requirements.txt파일을 업데이트하여 종속성을 지정합니다.fabric-user-data-functions ~= 1.0 pandas == 2.3.1 numpy == 2.3.2 requests == 2.32.5 scikit-learn=1.2.0 joblib=1.2.0 -
functions_app.py를 엽니다. scikit-learn을 사용하여 데이터 과학을 위한 사용자 데이터 함수를 개발하는 예제는 다음과 같습니다.import datetime import fabric.functions as fn import logging # Import additional libraries import pandas as pd from sklearn.ensemble import RandomForestClassifier from sklearn.preprocessing import StandardScaler from sklearn.model_selection import train_test_split from sklearn.metrics import accuracy_score import joblib udf = fn.UserDataFunctions() @udf.function() def train_churn_model(data: list, targetColumn: str) -> dict: ''' Description: Train a Random Forest model to predict customer churn using pandas and scikit-learn. Args: - data (list): List of dictionaries containing customer features and churn target Example: [{"Age": 25, "Income": 50000, "Churn": 0}, {"Age": 45, "Income": 75000, "Churn": 1}] - targetColumn (str): Name of the target column for churn prediction Example: "Churn" Returns: dict: Model training results including accuracy and feature information ''' # Convert data to DataFrame df = pd.DataFrame(data) # Prepare features and target numeric_features = df.select_dtypes(include=['number']).columns.tolist() numeric_features.remove(targetColumn) X = df[numeric_features] y = df[targetColumn] # Split and scale data X_train, X_test, y_train, y_test = train_test_split(X, y, test_size=0.2, random_state=42) scaler = StandardScaler() X_train_scaled = scaler.fit_transform(X_train) X_test_scaled = scaler.transform(X_test) # Train model model = RandomForestClassifier(n_estimators=100, random_state=42) model.fit(X_train_scaled, y_train) # Evaluate and save accuracy = accuracy_score(y_test, model.predict(X_test_scaled)) joblib.dump(model, 'churn_model.pkl') joblib.dump(scaler, 'scaler.pkl') return { 'accuracy': float(accuracy), 'features': numeric_features, 'message': f'Model trained with {len(X_train)} samples and {accuracy:.2%} accuracy' } @udf.function() def predict_churn(customer_data: list) -> list: ''' Description: Predict customer churn using trained Random Forest model. Args: - customer_data (list): List of dictionaries containing customer features for prediction Example: [{"Age": 30, "Income": 60000}, {"Age": 55, "Income": 80000}] Returns: list: Customer data with churn predictions and probability scores ''' # Load saved model and scaler model = joblib.load('churn_model.pkl') scaler = joblib.load('scaler.pkl') # Convert to DataFrame and scale features df = pd.DataFrame(customer_data) X_scaled = scaler.transform(df) # Make predictions predictions = model.predict(X_scaled) probabilities = model.predict_proba(X_scaled)[:, 1] # Add predictions to original data results = customer_data.copy() for i, (pred, prob) in enumerate(zip(predictions, probabilities)): results[i]['churn_prediction'] = int(pred) results[i]['churn_probability'] = float(prob) return results -
F5 키를 눌러 함수를 로컬에서 테스트합니다.
-
Fabric 확장 프로그램의 **로컬 폴더**에서 함수를 선택하고 작업 영역에 게시합니다.
함수 호출에 대해 자세히 알아보기
데이터 과학을 위한 Fabric 노트북 사용
Fabric 노트북은 Microsoft Fabric에서 코드, 시각화 및 마크다운을 나란히 작성하고 실행할 수 있는 대화형 워크북입니다. 노트북은 여러 언어(Python, Spark, SQL, Scala 등)를 지원하며 Fabric에서 OneLake의 기존 데이터를 사용하여 데이터 탐색, 변환 및 모델 개발에 이상적입니다.
예
아래 셀은 Spark를 사용하여 CSV를 읽고, pandas로 변환하고, scikit-learn으로 로지스틱 회귀 모델을 학습시킵니다. 데이터셋 값에 따라 열 이름과 경로를 바꾸세요.
def train_logistic_from_spark(spark, csv_path):
    # Read CSV with Spark, convert to pandas
    sdf = spark.read.option("header", "true").option("inferSchema", "true").csv(csv_path)
    df = sdf.toPandas().dropna()

    # Adjust these to match your dataset
    X = df[['feature1', 'feature2']]
    y = df['label']

    from sklearn.model_selection import train_test_split
    from sklearn.linear_model import LogisticRegression
    from sklearn.metrics import accuracy_score

    X_train, X_test, y_train, y_test = train_test_split(X, y, test_size=0.2, random_state=42)
    model = LogisticRegression(max_iter=200)
    model.fit(X_train, y_train)

    preds = model.predict(X_test)
    return {'accuracy': float(accuracy_score(y_test, preds))}

# Example usage in a Fabric notebook cell
# train_logistic_from_spark(spark, '/path/to/data.csv')
Microsoft Fabric Notebooks 설명서를 참조하여 자세히 알아보세요.
Git 통합
Microsoft Fabric은 버전 제어 및 데이터 및 분석 프로젝트 전반의 협업을 지원하는 Git 통합을 지원합니다. Fabric 작업 영역을 Git 리포지토리(주로 Azure DevOps 또는 GitHub)에 연결할 수 있으며 지원되는 항목만 동기화됩니다. 이 통합은 CI/CD 워크플로를 지원하여 팀이 릴리스를 효율적으로 관리하고 고품질 분석 환경을 유지할 수 있도록 합니다.

다음 단계
VS Code에 Microsoft Fabric 확장 프로그램 설정이 완료되었으므로 다음 리소스를 탐색하여 지식을 심화하세요.
커뮤니티와 교류하고 지원받기